Model-based tracking of C. elegans for behavioural characterisation
D. Butcher1,
P. Courtney1, M. Gill2, 3 and G.J. Lithgow
1Imaging
Science and Biomedical Engineering, University of Manchester, Manchester,
United Kingdom
2Department of Child Health, University of Manchester, Manchester,
United Kingdom
3School of Biological Sciences, University of Manchester, Manchester,
United Kingdom
Caenorhabditis elegans (C. elegans) is a small (1.2 mm) soil-dwelling nematode worm that has been used extensively as a model organism. The anatomy and complete cell lineage has been well-characterised [1]. More recently the whole genome has been sequenced making C. elegans a versatile and tractable model for a number of biological systems. In particular it has been used to define genes involved in growth, development and ageing [2]. Mutations that affect these phenotypes are often associated with characteristic behavioural patterns that can be difficult to quantify. The development of software that can track and analyse motion efficiently would greatly improve phenotypic selection and help define as yet uncharacterised genes that have an impact on growth and behaviour.

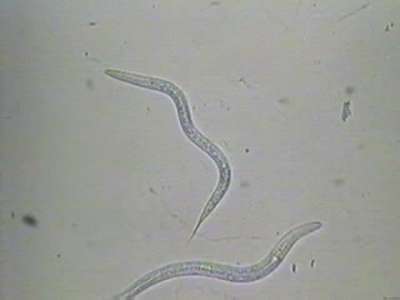
Figure 1. C. elegans in motion.
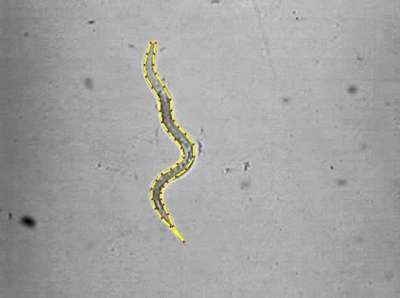
The worm is of a long thin semi-transparent appearance. It can adopt a wide variety of shapes and displays different types of motion for behaviours such as feeding and foraging. Figure 1 shows two worms in motion. To analyse the worms a deformable template model was used. Deformable models [3] describe a shape in terms of a mean and a set of modes of variation. These are calculated from a set of marked-up images of the object by the use of well-founded statistical techniques such as principal component analysis. Figure 2 shows a marked-up worm image. Deformable models have been widely applied by computer vision researchers for modelling a wide range of static objects [4]. They have also been used to provide quantifiable growth measurements for nematode worms [5].

Figure 2. Boundary land-marked worm.
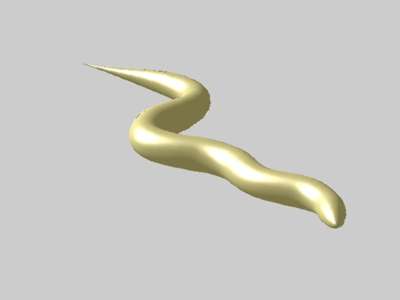
Thirty worm images were selected from a four and a half-hour video sequence to form a training set. A deformable model of the worm was generated from the worm outlines in the training set images. The generated model was used to locate and track worms in 40 sequential non- training images. A 3D visualisation of a located worm can be seen in Figure 3.

Figure 3. 3D visualisation of located worm.
Paper presented at Measuring Behavior 2000, 3rd International Conference on Methods and Techniques in Behavioral Research, 15-18 August 2000, Nijmegen, The Netherlands
© 2000 Noldus Information Technology b.v.