Updates to the Graze program: movement analysis and compatibility with "The Observer"
R.A. Champion and S.M. Rutter
Institute of Grassland and Environmental Research, North Wyke, Okehampton, United Kingdom
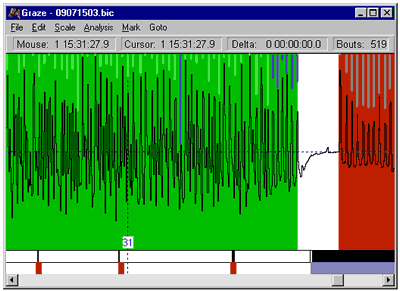
"Graze" is a program for analysing grazing behaviour data files collected by the "IGER Behaviour Recorder" [2]. The program (presented at Measuring Behavior '98 [3]) has recently been improved to allow lying, standing and walking behaviour to be analysed. A tilt switch is attached to the animal's leg and this produces an active signal when the animal walks or lies down [1]. The Behaviour Recorder samples this digital signal at 20 Hz and stores the data in parallel with the jaw movement data on a compact flash memory card. The latest version of Graze determines the pattern of lying/standing bouts over the day and the occurrence of steps. Lying is recorded when at least 95% of the samples are active for at least 8 seconds. 3 parameters are used to define a step; minimum step length, noise tolerance and interval. An interval must occur between steps and noise tolerance is the maximum number of inactive samples that can occur during a step. The maximum length of a step is 8 seconds. Graze displays the raw digital samples from the movement sensor and then displays the results after the data have been analysed. Periods of lying are shown as a blue bar and steps are shown as red blocks, both are shown below the jaw signal interpretation. Graze stores the times of transitions between lying and standing and vice versa and it stores the start and end times of individual steps (the time at which a step 'event' occurs is taken as the start time of the step).
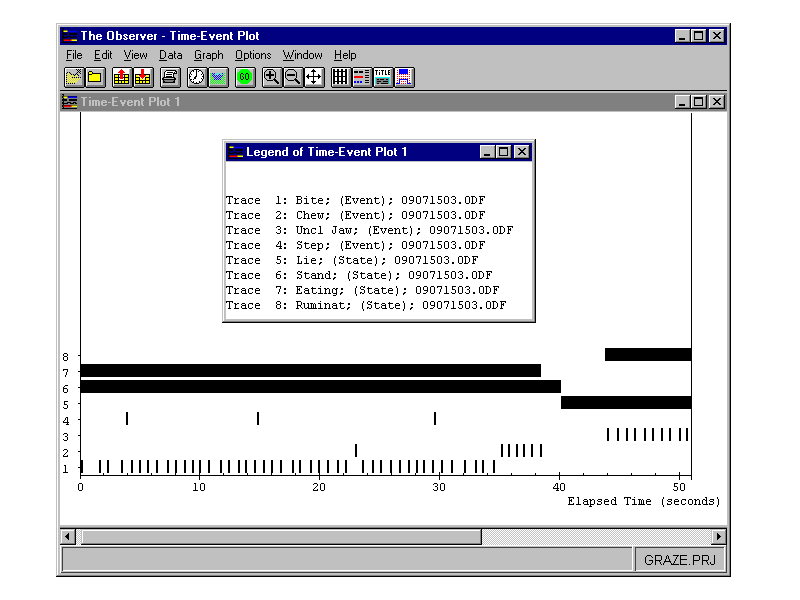
Graze has recently been improved to include the option to export the analysis results as an ODF file compatible with The Observer (Noldus Information Technology). Jaw movements, which consist of prehension bites, mastications and rumination chews, are classified as events, as are steps. The behaviours associated with the jaw movement analysis (eating, ruminating and idling) as well as body position (standing or lying) are classified as states.

Figure 1. A typical Graze screen showing eating (highlighted block on left), ruminating (highlighted block on right), walking steps (bottom left) and lying down (bottom right). Eating jaw movements are divided into prehension bites and mastications (highlighted by vertical lines).

Figure 2. A time-event plot produced by The Observer for the data shown in the Graze window above.
Graze allows the user to define an extraction period from within the original recording period, for example a 24 h measurement period from a 25.5 h recording. Once the data have been imported into The Observer, the program can perform powerful behavioural analysis, such as summarising data over short intervals, determining distance moved per bite and testing the effect of external events and states.
Poster presented at Measuring Behavior 2000, 3rd International Conference on Methods and Techniques in Behavioral Research, 15-18 August 2000, Nijmegen, The Netherlands