Ground reaction force measurement in the mouse
K.A. Clarke, L. Smart and J. Still
Department of Biomedical Science, University of Sheffield, Sheffield, United Kingdom
Measurement of the forces (P) acting on the ground at each limb placement during locomotion, has been shown to be a sensitive and non-invasive method for analysing the relative contribution of each limb to the breaking, support and propulsive phases of the gait cycle. Further, it allows subtle changes in movement associated with a variety of pathophysiological states to be assessed and the value of potential therapies quantified [1,3]. The smaller the animal, however, the more technically difficult the measurement becomes. The current emphasis on mouse models of human diseases has directed us more recently [2] to attempt to examine the reaction forces during locomotion of the mouse to give us a platform for future measurements in such models.
To this end each mouse (MF1 strain, mean weight 45 g) was placed in a perspex chamber 100 cm long x 4 cm wide x 6.5 cm high. Part of the chamber floor consisted of an array of glass plates forming the platforms of load cells to measure the vertical reaction force (Pz). The mouse was videoed from below to allow association of limb with force profile.
The peak Pz transmitted via right and left sides are symmetrical but those via forelimbs (FL) are about 5% greater than those via hindlimbs (HL) at 63.5 ± 0.6% and 58.5 ± 0.7% (mean ± SEM) of body weight respectively. The areas under the Pz curves for FL and HL, however, are not significantly different since the latter has a longer stance time (164 ± 6.1 ms and 190 ± 7.7 ms, respectively).
The Pz curves for FL and HL in mice travelling at or around average velocity each consists of 3 distinct phases, lasting from 12.4 to 27% of the total time. The major difference is that for FL two of the phases occur prior to the peak, while for HL two of the phases occur after the peak, reflecting presumed differential useage of FL and HL. We are currently identifying the paw contact features associated with these phases and examining Pz characteristics in abnormal mice.
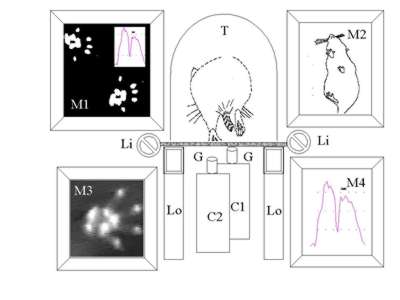
Figure 1. Diagram of the apparatus used to collect spatiotemporal and vertical reaction force data. A plexiglass tunnel (T), over a glass walkway (G), internally illuminated by lights (Li) positioned along the edges, and under which are placed video cameras (C). For spatiotemporal data two cameras are used (C1 and C2) positioned to view short overlapping lengths of the chamber. Their output goes via a video splitter to monitor M1. Monitor M3 shows a detailed paw print of a passing image of a forepaw track through a frame grabber. For the purpose of vertical reaction force measurement, the glass walkway is divided into sections, each forming the platform of a load cell (Lo), with output to a data acquisition device . Image on monitor M4 is matched with load profiles of data acquisition monitor M2.
This work was performed with the generous support of a grant from the Animal Procedures Committee of the Home Office, UK, under Project Licence PPL 50/1177.
Paper presented at Measuring Behavior 2000, 3rd International Conference on Methods and Techniques in Behavioral Research, 15-18 August 2000, Nijmegen, The Netherlands