SEE: Software for the Exploration of Exploration
D. Drai1, G. Elmer2, Y. Benjamini3, N. Kafkafi1 and I. Golani1
1Department
of Zoology, Tel Aviv University, Tel Aviv, Israel
2Department of Statistics and OR, Tel Aviv University, Tel Aviv,
Israel
The complexity of exploratory behavior creates a need for a visualization and analysis tool that will highlight regularities and facilitate the generation of new hypotheses and algorithms of quantification. SEE is a program developed by us for this aim. The raw data for SEE are a time series of the animal's coordinates in space, sampled at a rate that permits a meaningful computation of velocities (~10 Hz).
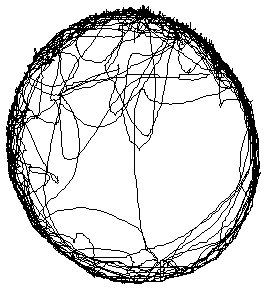
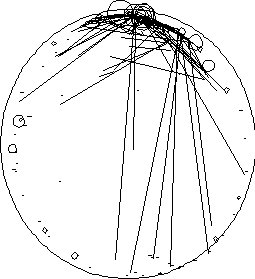
Figure 1. A path plot created by a hooded rat in a 6.50 m diameter arena during a 20 min session (left) and an analysis of that path into segments (right). "Bubbles" represent stops, where the size of the bubble stands for stop duration. Movement segments are represented as straight lines that connect the start and end points of the segment, regardless of the actual path. The analysis on the right highlights home base location and the straight lines highlight the home base's high connectivity to most of the arena.
SEE provides:
We will demonstrate the properties of SEE on our computer demo both on our own and other laboratories' data, provided data files are sent to us for examination and preparation (smoothing and initial segmentation), and found appropriate, 6 weeks ahead of time. EthoVision track files are welcome, as well as any other format consisting of a time series of coordinates in a machine-readable form.
This project is supported by NIH grant 1 R01 NS40234-01.
Poster presented at Measuring Behavior 2000, 3rd International Conference on Methods and Techniques in Behavioral Research, 15-18 August 2000, Nijmegen, The Netherlands
© 2000 Noldus Information Technology b.v.