Data synchronisation through post-processing
P.J. Hoogeboom
National Aerospace Laboratory NLR, Amsterdam, The Netherlands
One of the almost sacred paradigms in experimental research is the recording of all data on one single recorder. Sometimes several tricks have to be used to accomplish this feat. The advent of modern computers has led to the possibility to store all data in separate data files, whilst still using a common clock. This allows more efficient data storage whilst maintaining the required time lock. For ambulatory experiments, as performed at the National Aerospace Laboratory NLR, it is sometimes necessary to record data at separate places without the use of elaborate and overlapping clock information. However, at the same time, it is often possible to record a simple signal at all recording places. This is true even if the raw signal information is not maintained. For example, when recording video and performance data, it is normally possible to use a flashing (infrared) Light Emitting Diode (LED). The flashing sequence can be measured electronically with the performance data, whilst the (ambulant) light changes can be recovered from the video information.
This presentation deals with the problem of how to correct the time differences using the overlapping information in the separate recordings. Two main problems need to be corrected. The first and most obvious one is the start time. In practice it is almost impossible to start all recordings at exactly the same time, therefore some time-offset has to be applied to one (or multiple) of the recordings. The second problem deals with differences in recording speed. As much to our surprise, we have encountered differences in clock-speeds of up to 5%. Several causes can be mentioned for those differences. The simplest one is a difference in recorder clock speed, which can be overcome by using appropriate devices. The way the recording has been integrated into, for example, the simulation software also presents surprises. Problems in this respect were encountered using simulation devices from several European organisations, so the problem seems universal in the way that small mistakes or inappropriate assumptions are made over and over again.
If all separate recordings are not too diverse in their time-channel information (e.g. do not contain hidden jumps in the recording times), the separate data files can be linked together using the information correlation in overlapping channels. In this respect a single recording is assumed to contain multiple parameters, linked together through some internal clock. The separate parameters may be sampled at different rates or may even be different modalities (for example equidistant analogue sampled versus discrete event based data).
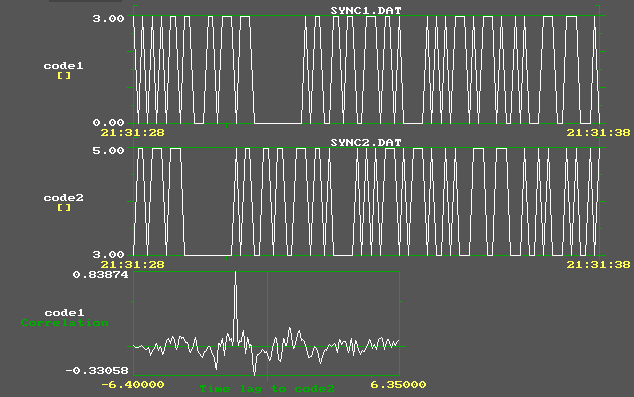
To enhance the resolution of the correlation function, a special digital code can be used. The code requirements can be summarised as having a high correlation for signals without time offsets and a low correlation for signals with some time difference. Also the 'code-repetition distance' should be sufficient to avoid inappropriate locks. A large amount of research has already been performed in this area of Pseudo Random Noise (PRN) codes, the earliest references dating back to 1965 [1,2,3,6]. Some navigation systems like the Global Positioning System (GPS) even rely solely on similar types of codes. Also similar techniques are widely used in cellular phone systems like GSM. An example of a PRN code is given in Figure 1.

Figure 1. time histories of code signals, taken form two separate measurements.
The picture shows two different measurements containing overlapping information 'code1' and 'code2'. The chip-rate for both codes is 10 Hz (meaning a maximum of 10 signal changes per second). The correlation between the two signals is indicated in the lower display. Clearly can be seen that the peak of the correlation is about 1.5 s before the 'no offset' location (green vertical line). The same conclusion can be derived from the two time-histories, from which it is easy to see that the code2 signal is earlier than the code1 signal.
Another conclusion from the example is that the peak in the correlation function is still relatively high when considering the time-difference of 1.5 s combined with a data window length of only 10 s. Increasing the data window length can easily enlarge the peak at the cost of increased computation times.
The example shows the suitability of using the PRN for detecting differences in recording times. However some questions on its use remain. Within the context of the HEART [4] and Visual Lab [5] projects, some simple experiments have been performed to analyse the suitability of the application of the 'pseudo-random bit'-code for the purpose of synchronising the data files through post-processing. The experiments focussed on the performance of different kinds of 'synchronisation function' implementations (like automated determination of time offset, time gain and time jumps). It was found that the correlation technique is highly suited to detect time differences between the different measurements. Major deformations in the signal representation are allowed. By using a 'sliding window technique' the occurrence of time jumps (including its magnitude) between measurements can be detected. However the main problem found is that the robustness for differences in recording speed (time gain) is lacking. Therefore, other information, like the estimated frequency of code changes, has to be used to make the whole synchronisation technique reliable and suitable for automation.
Paper presented at Measuring Behavior 2000, 3rd International Conference on Methods and Techniques in Behavioral Research, 15-18 August 2000, Nijmegen, The Netherlands