EthoVision
for Windows: a new video tracking system for automation of behavioral experiments
R.A.J. Tegelenbosch,
M.O.S. Buma, A.H.M. Hendriksen and L.P.J.J. Noldus
Noldus
Information Technology b.v., Wageningen, The Netherlands
The EthoVision video
tracking system has become a standard instrument for automation of behavioral
experiments in hundreds of laboratories around the world. Since its introduction
in 1993, the functionality of the software has been expanded with every new
release. Since the last major DOS upgrade in 1997, we have completely redesigned
and rewritten the original EthoVision software, resulting in a robust 32-bit
application optimized for Windows 95/98. In this presentation, the most significant
new and enhanced software features in EthoVision 2.0 will be reviewed.
One of the novelties
in EthoVision for Windows is the Experiment Explorer. This new tool allows you
to organize your experiments according to your own specific needs and wishes.
EthoVision 2.0 introduces the concept of a workspace, a folder holding one or
more experiments (Figure 1, left pane). For example, you can create a different
workspace for each user or place all experiments belonging to the same research
project in the same workspace. The Experiment Explorer will keep track of all
experiments and associated profiles and data files. This way you can increase
the efficiency with which you set up new experiments, by simply copying the
necessary profiles from previous experiments.
In the experimental design
you can now easily predefine the independent variables in a comprehensible spreadsheet.
The number of variables you can define is unlimited, allowing an elaborate experimental
design. With the available copy and paste functionality and the automatic sort
options any experiment is quickly set up.
In EthoVision for Windows
the signal from the video camera is directly displayed on the computer screen.
This way the definition of arenas and zones or points of interest is much easier
(Figure 1, right pane). During the actual data acquisition the live video images,
arena definition and tracks are visible on the computer screen.
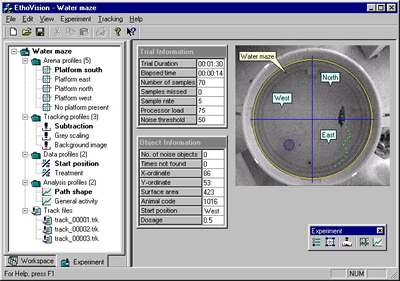
Figure 1. This
screenshot gives an overview of the EthoVision desktop. In this example,
the left pane (Experiment Explorer) shows the structure of a Morris water
maze experiment. To define the arena and zones of interest, the right pane
displays the video image of the experimental setup.
The analysis report of
the DOS version has been replaced by a spreadsheet with the results of the analysis.
You can manipulate the layout of this table for optimal presentation: just reorder
the rows and columns to fit your needs. The analysis results can still be exported
in different file formats to other spreadsheets or statistics packages for further
analysis, but an easier and faster way is to copy and paste the data directly.
Paper presented at Measuring
Behavior 2000, 3rd International Conference on Methods and
Techniques in Behavioral Research, 15-18 August 2000, Nijmegen, The Netherlands
© 2000 Noldus
Information Technology b.v.