Reliability analysis on continuously measured behavioral data
R.G. Jansen, R.G.M. Elbers, E.S. Meyer and L.F. Wiertz
Noldus Information Technology bv, Wageningen, The Netherlands
Background
Reliability analysis theory has been developed for assessing, on a nominal scale,
a series of cases by two independent raters. For each case, the assessment results
are tallied in a confusion matrix: a contingency table in which agreements
and disagreements in the classifications of both raters are presented (Figure
1). Reliability statistics, such as percentage of agreement, Cohen's kappa
(agreement corrected for chance agreement) and Pearson's correlation coefficient
rho, can be computed from the confusion table.
| |
Rater 2
|
|
Rater 1
|
Nominal value
|
A
|
B
|
C
|
|
A
|
2
|
3
|
0
|
|
B
|
0
|
4
|
1
|
|
C
|
1
|
1
|
3
|
Figure 1. Example
of a contingency table in which agreements and disagreements have been tallied.
Reliability analysis and continuously recorded behavioral data
In behavioral research, reliability analysis must deal with two sets of time-structured data ('observations'). This is not a problem if the two observations compared involve behaviors sampled at fixed intervals, since each sample then corresponds with a case. But if they involve behaviors that have been recorded continuously, such that the start and end of each case are measured subjectively, the following problems arise in finding a basis for comparing the data sets:
- The number of cases must be assessed subjectively, since one does not know
how many behaviors have occurred (Figure 2).
- Assigning nominal values (behavioral records) to cases is difficult, since
a rater may not make an assessment for each case (e.g. the rater may have
overlooked a behavior).
- Overlap of cases: making a simple choice between 'agreement' and 'disagreement'
for each case, and tallying the results in the contingency table, may not
be appropriate, since cases may overlap only partially in time. Using the
duration of overlap as the result of each comparison, instead of the
choice between agreement and disagreement, produces a contingency table that
better reflects the actual agreement.
|
|
Observation 1
|
Observation 2
|
|
Case
|
Behavior
|
time
|
Behavior
|
time
|
|
1
|
Walk
|
0
|
Walk
|
0
|
|
2
|
Jog
|
5
|
-
|
-
|
|
3
|
-
|
-
|
Run
|
7
|
|
4
|
Hold
|
12
|
Hold
|
11
|
|
|
Observation 1
|
Observation 2
|
|
Case
|
Behavior
|
time
|
Behavior
|
time
|
|
1
|
Walk
|
0
|
Walk
|
0
|
|
2
|
Jog
|
5
|
Run
|
7
|
|
3
|
Hold
|
12
|
Hold
|
11
|
Figure 2. Example
showing the difficulty of objectively determining the number and type of cases.
Reliability analysis
using The Observer software
The Observer 4.1 offers a new set of reliability functions capable of taking
the time-structured nature of the data into account. Reliability analyses are
based on four different methods of comparing continuously recorded data sets,
which differ in the way the three problems mentioned earlier are dealt with:
- Cases and corresponding values are either identified through an algorithm
that takes into account the overlap of behaviors in time and sequences of
behaviors, or not identified at all.
- The results of comparisons for each case can either be presented as 'duration
of overlap' or 'agreement/disagreement'.
Furthermore, The Observer
presents outcomes at different levels:
- A list of coupled behaviors and their assessment (agreement or disagreement),
for a detailed analysis of reliability per case (not applicable to duration-based
and frequency-based comparison; Figure 3).
- A confusion matrix of behaviors (Figure 4).
- An overview of reliability statistics, including percentage agreement,
index of concordance, Cohen's kappa and Pearson's rho (Figure
5).
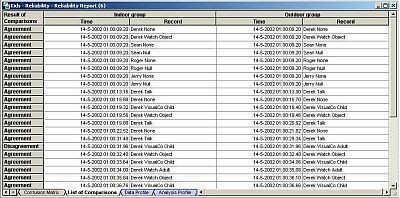
Figure 3. Example of
a case-by-case comparison in The Observer 4.1.
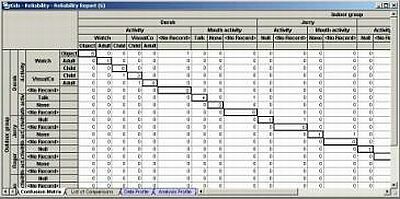
Figure 4. Example of
a confusion matrix in The Observer 4.1.
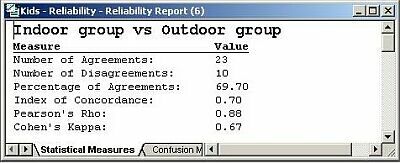
Figure 5. Example of
reliability measures in The Observer 4.1.
Paper presented at Measuring
Behavior 2002 , 4th International Conference on Methods and
Techniques in Behavioral Research, 27-30 August 2002, Amsterdam, The Netherlands
© 2002 Noldus
Information Technology bv