Principal components and curves for describing rodent behavior
D. de Ridder
Department for Applied Physics, Delft University of Technology, Delft, The Netherlands
In this project, we investigate the use of low-dimensional, nonlinear models to describe high-dimensional data, such as images or movies. A natural application of such techniques is the observation of animal behavior, which we study in co-operation with Noldus Information Technology.
Traditionally, computer-aided animal studies (performed in e.g. medicine or genomics) involve two steps. First, a video sequence is obtained of an animal in a test situation (i.e. subjected to some physical affliction or stress, or to pharmaceuticals). Next, this video sequence is annotated by a human observer. This is both time-consuming and subjective, as inter-observer variability can be quite high. The goal of this project is to produce a low-dimensional description of the video sequence, facilitating automatic classification of animal behavior.
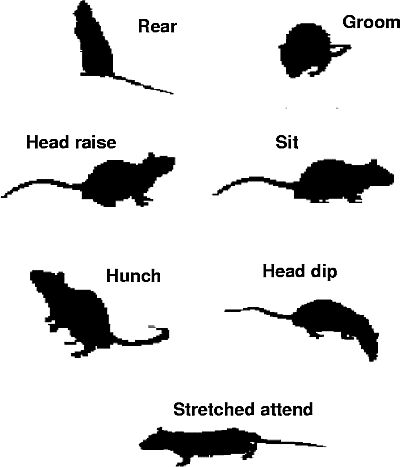
Our work is based on data obtained from the Eureka project [1], a set of movie files of rodent behavior containing roughly 2,500 frames each. Each frame has been classified manually into one of 9 distinctive modes of behavior (7 of which are illustrated in Figure 1). The approach we take is inspired by adaptive shape models (ASM) [2]. For each frame, we automatically extract and pre-process the contour of the rodent (Figure 2). The resulting set of contours, represented as 50 (x,y) coordinate pairs, can then be viewed as a data set in a 100-dimensional space. Traditional data analysis methods, such as principal component analysis (PCA), can then be used to find significant directions in the data set. Figure 3 shows that, while the components themselves (indicated by 1-5) seem to correspond to major changes in posture, the projected data do not show a clear clustering of behavior types. This could be caused by our automatic contour extraction, unreliable labelling, or by the fact that we use only video sequences shot from a position above the experimental area. These topics will be addressed in further research.
Figure 1. Prototypical behavior.
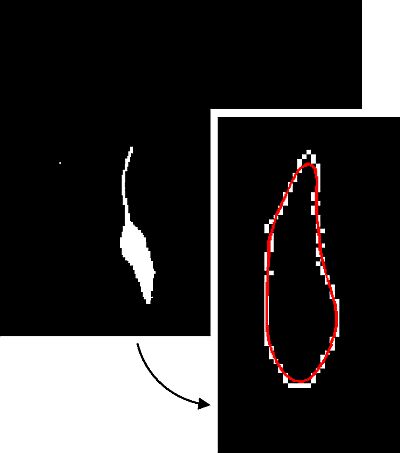
Figure 2. The contour extraction process.
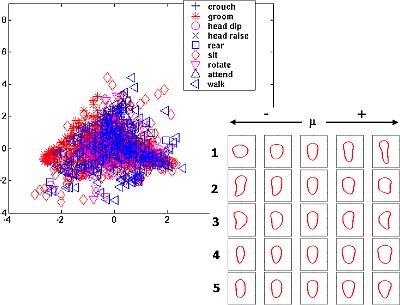
Figure 3. Principal components.
We have also fitted principal curves [3] nonlinear generalisations of principal components to these data. Figure 4 shows some initial results. The single curves seem to describe all major body changes, but as yet they do not give a clear separation of behavior types. The three curves correspond to the setting of an important regularisation parameter, r, which controls how curved the data description can become. This parameter clearly has significant influence on the resulting curve; finding a correct setting is an important goal for further research.
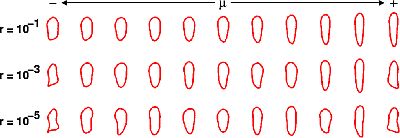
Figure 4. Principal curves.
This project is sponsored by the Dutch Foundation for Applied Sciences (STW).
References
Paper presented at Measuring Behavior 2002 , 4th International Conference on Methods and Techniques in Behavioral Research, 27-30 August 2002, Amsterdam, The Netherlands