 |
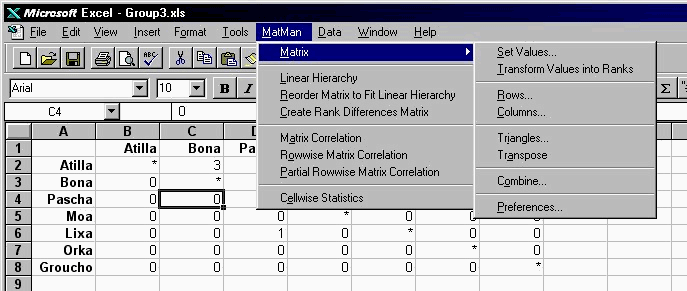
| Figure 1. The application window of Microsoft Excel, showing the MatMan menu that provides matrix manipulation and analysis functions. |
Ethological analysis on sociometric matrices using MatMan for Windows
A.H.M. Hendriksen1, H. de Vries2, A.L.M. van Boxtel1, R.G. Jansen1 and R.J.H. Trienes1
1 Noldus Information Technology b.v.,
Wageningen, The Netherlands
2 Department of Ethology & Socio-Ecology, Utrecht University,
Utrecht, The Netherlands
Researchers interested in social structure, whether they study primate colonies, a flock of birds, groups of children, people in a meeting or any other group-living species, may wish to gain insight in the dominance hierarchy of the group studied. Behavioral interactions between the individuals can be represented in a sociometric matrix, in which each cell contains the frequency of interactions shown by one individual (the actor) towards another individual (the receiver). In order to facilitate the manipulation and analysis of matrices, MatMan has been developed [1]. MatMan allows the researcher to determine the dominance matrix representing the hierarchy within the group. Furthermore, an assessment of the strength, as well as the statistical significance, of the linearity in the observed dominance relationships can be obtained [3, 4]. The dominance matrix can additionally be reordered to reflect the social structure in the observed group of individuals [5].
|
| Figure 1. The application window of Microsoft Excel, showing the MatMan menu that provides matrix manipulation and analysis functions. |
At the conference we will present the new Windows version of the program (Figure 1). MatMan for Windows has been designed as an add-in for Microsoft Excel. Matrices can be imported from other programs (e.g. The Observer) or typed in manually. Besides an elaborate set of options to manipulate the structure and content of a matrix, MatMan provides a set of matrix analysis functions. The functions are especially suitable for sociometric matrices, behavioral profile matrices and behavioral transition matrices allowing the user to investigate social dominance [4, 5], to apply matrix correlation methods [2] or to study the structure of behavior statistically.
Paper presented at Measuring Behavior '98, 2nd International Conference on Methods and Techniques in Behavioral Research, 18-21 August 1998, Groningen, The Netherlands