FaceReader: new developments in facial expression analysis
Organizers/Presenters:
Tim den Uyl (VicarVision, The Netherlands)
Hans Theuws (Noldus Information Technology, The Netherlands)
Schedule: Thursday 28th August 10:00 - 10:20, Haakzaal.
This demonstration will be followed immidately by the demonstration of FaceReader Online.
Abstract:
There is an increasing interest for methods that enable automatic analysis of emotions in different areas, such as psychology, consumer behavior, market research, human factors, usability, etc. Detecting emotions by analyzing facial expressions is one of the possibilities, offering a non-invasive solution. FaceReaderTM is one of the software tools available nowadays for analysis of facial expressions.
FaceReader automatically analyzes the basic facial expressions (neutral, happy, sad, angry, disgusted, surprised and scared) from video, live, or from an image. When analyzing one or more participant videos or image files, values can be visualized as bar graphs, in a pie chart, and as a continuous signal. Another graph displays the negativity or positivity of the emotion (valence). A separate reporting window displays a pie chart with percentages, a smiley, and a traffic light, indicating whether a person’s mood is positive, neutral, or negative. All visualizations are given real-time and may be viewed afterwards.
The very first version of FaceReader that allowed real-time facial expression analysis already dates from 2005, but since then a lot of engineering has been done, and development is still going on. During this demonstration we would like to introduce a number of new progresses, such as:
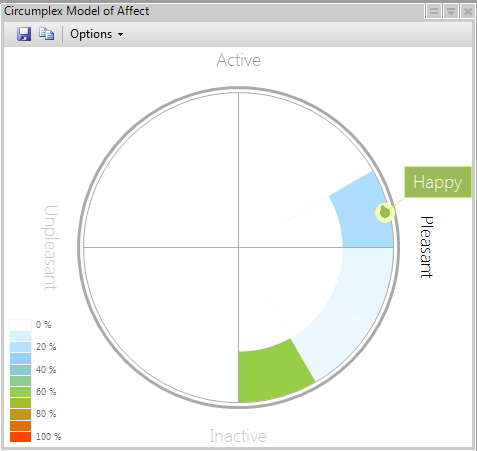
- Arousal can be analyzed as a new secondary or derived facial measurement, next to valence. This measurement can be visualized in a circumplex model, which displays valence and arousal on a circular chart.
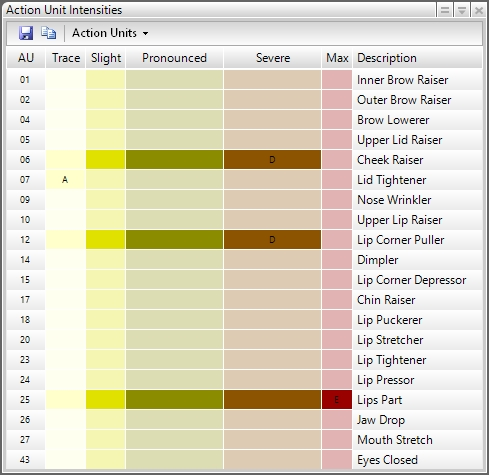
- For a more detailed analysis of facial expressions, it is possible to measure the intensity of 20 commonly used Action Units, such as raising of cheeks, wrinkling of nose, dimpling, and lip tightening. When an Action Unit is active, its intensity is displayed in 5 categories A (Trace), B (Slight), C (Pronounced), D (Severe), E (Max). The output can be exported for further analysis in Excel, The Observer XT, or another program.
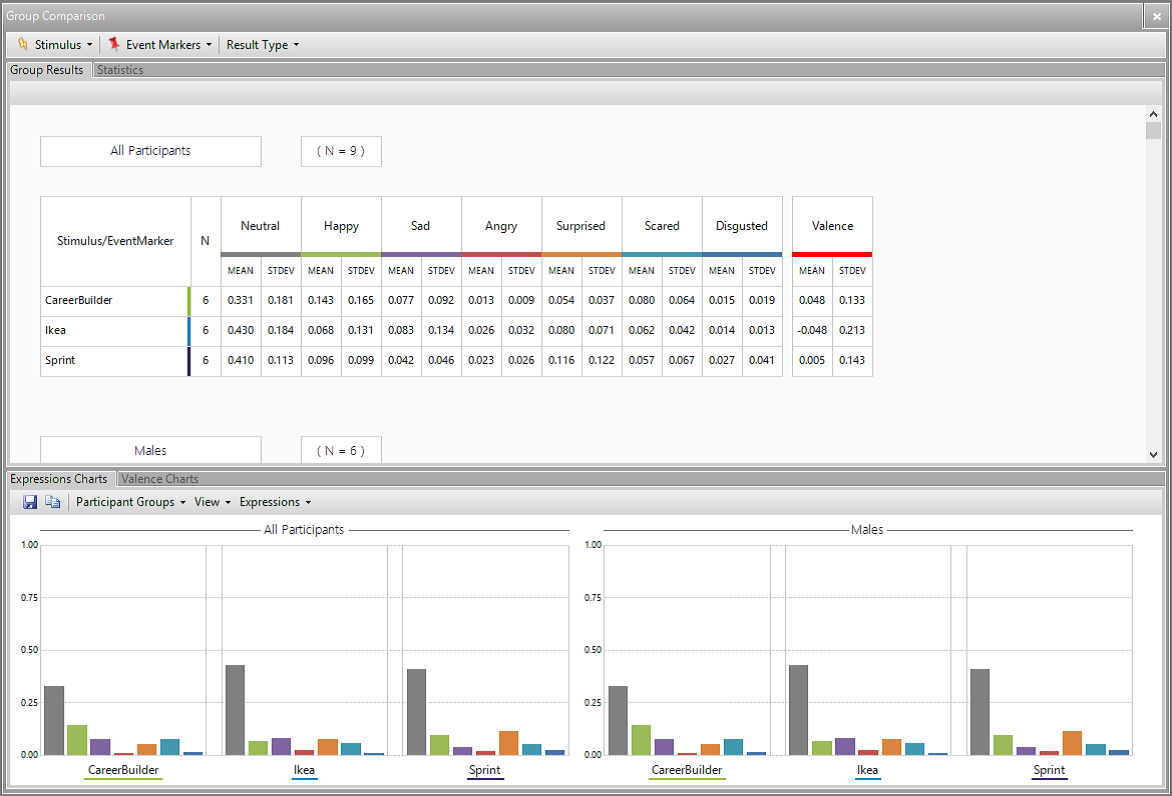
- Reporting the analysis of multiple test participants responses to different stimuli, and grouping results of participants based on independent variables is now also possible within FaceReader.
- Analysis of multiple persons simultaneously, which is relevant in observation settings such as meeting rooms, supermarkets, or museums. This development is more experimental and not yet fully implemented (this work is supported by the ITEA 2 project ‘Empathic Products’).