SWEET demonstrator: a crowd emotion monitor
Authors: John Schavemaker1, Ben Loke2, Mike Kelia2, Bas Huijbrechts1, Paul Ivan3, Arjen de Rijke4, Tom Regelink5, Lucas Noldus2, Martin Kersten4,6, Marten den Uyl3, Wouter van Kleunen7, Hans Scholten7, Paul Havinga7, Arno Pont1
1TNO, 2Noldus Information Technology, 3VicarVision, 4CWI, 5TASS, 6MonetDB, 7Twente University
Schedule: Thursday 28th August, 16:50-17:10, Pomonazaal
Introduction
SWEET (short for Sense & Tweet) will leverage state-of-the-art sensing, event processing, reasoning and data communication technologies to demonstrate a crowd emotion monitor, an application that is able to assess the behavior and emotion of groups of people and relay that information to stakeholders in a highly intuitive manner. The purpose of the SWEET demo is twofold:
•Enhancing experience: Information is collected and fed back to individuals or the crowd to enhance their experience of the event, e.g. to point at locations where there is a lot of activity or where many smiles have been detected. This applies to events where people gather for professional reasons (e.g. scientific conference) or for entertainment (e.g. dance party) and where they can benefit from an app that guides them to locations where they can gain the best experience.
• Increasing safety: Information is collected and interpreted in order to assess the stress level in a crowd, to detect behavior or emotion that can lead to an incident, or to detect incidents at an early stage. If such a situation occurs, first responders are alerted to take action at the appropriate location. This applies to any mass event in an open or closed space (soccer stadium, theatre, shopping mall, dance festival, etc.).
The measurement platform will be a smartphone using its built-in sensors. Combing many smartphones will make it possible to measure the behavior of a crowd. The SWEET app will measure:
• Location: Using the ‘fingerprint’ of Wi-Fi access points to track the participants.
• Sound level: The intensity and frequency of the ambient sound.
• Emotion — of the smartphone owner or others: Using facial expressions detected with camera and analyzed using the FaceReader analysis server.
• Subjective feedback: With an event-driven questionnaire tool about how the participants are feeling.
Pre-stored information (e.g. map or floor plan of the venue) and processed information (detected crowd behavior and emotion) from the event will be visualized in different ways. The app will give feedback to individual users, for instance to direct them to the location with the most positive experience or away from areas with problems. This will also be done by tweets to inform the people who have not installed the SWEET app. Aggregated data will also be visualized on a large display summarizing the experience of visitors at various locations.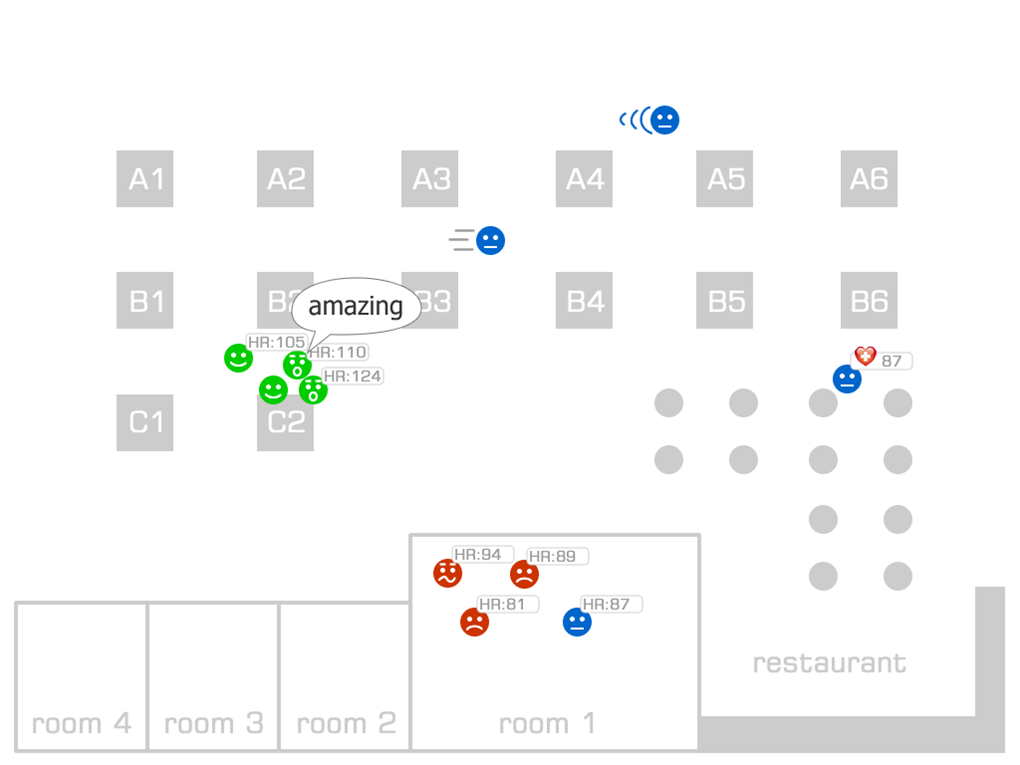
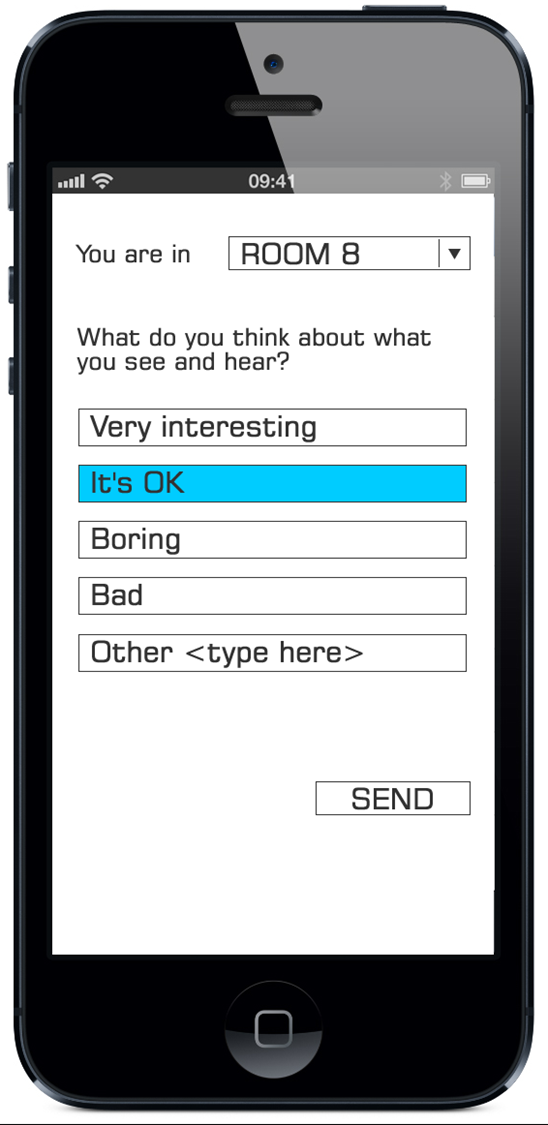
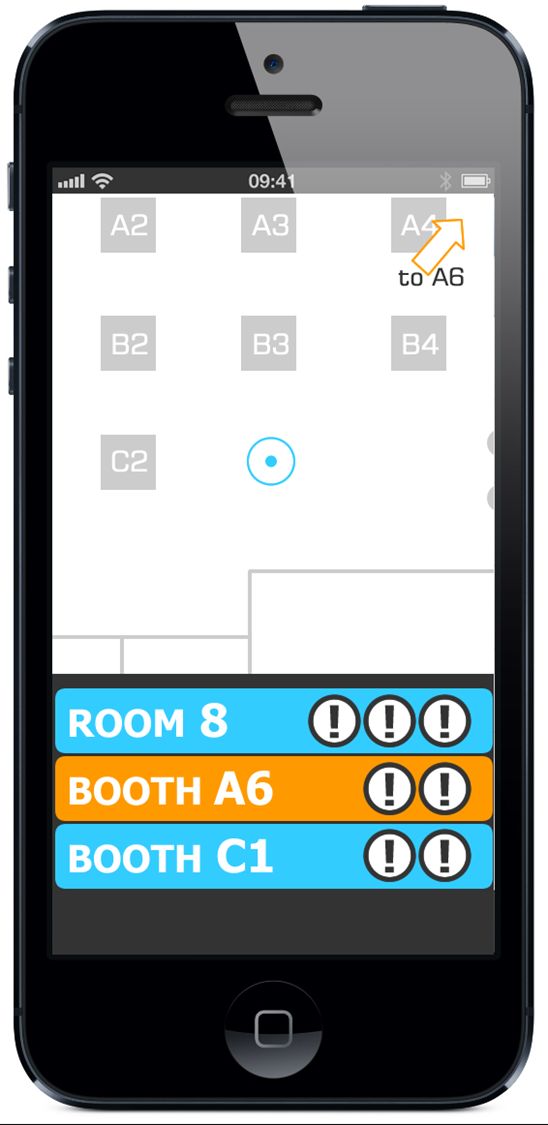
Figure 1: Example screenshot of central visualization and SWEET App screenshots.
System description
The measurement platform will be an Android smartphone, of which the built-in sensors will be utilized to create a multimodal data collection device. The SWEET app will collect location-based data from persons as well as the environment. Personal data will include movement and subjective feedback (information provided by the user). Ambient information will include noise level and emotion of persons nearby (via facial analysis). To minimize energy usage, only a few sensors will be active continuously. Events out of the ordinary will be used to trigger other sensors (e.g. twitter location, sound level, activity level). Combining many smartphones makes it possible to detect the behavior of a crowd. An example is the detection of a loud noise and its location, or detecting that people are running in the same direction or away from a central point.
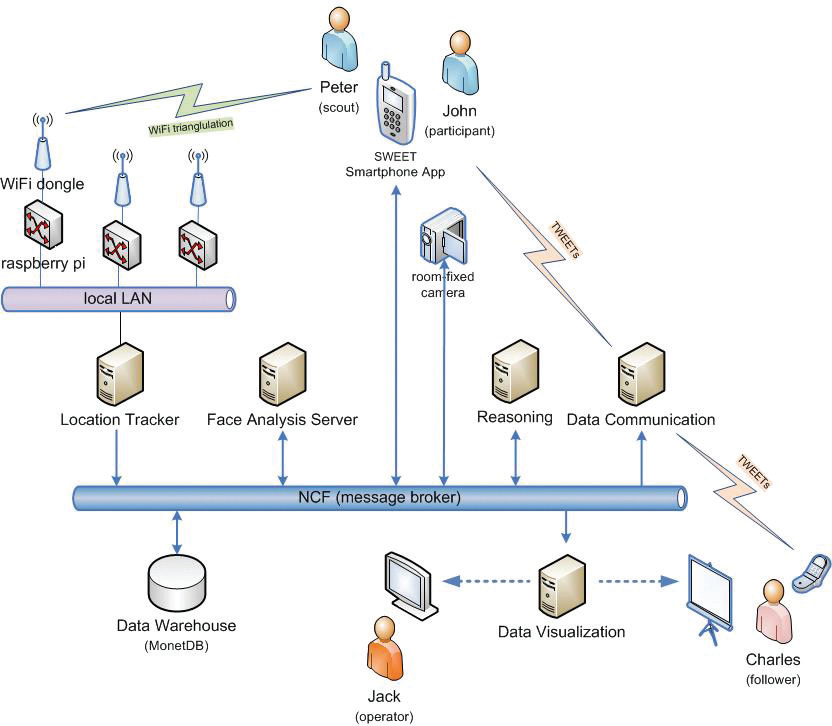
Figure 2: SWEET system overview.
The phone acquires the data, extracts meaningful information and sends only summaries to the server. This allows the server to perform high-level event processing and to provide its experience-enhancing services to subscribers. If the server receives multiple events actions can be taken to increase the collection of information at this location (from other phones or existing infrastructure), e.g. photos or video. Persons in the zone-at-risk can be warned via a message, first responders can be alerted, and in the ultimate case, the public can be informed – via twitter, other social media or SMS – e.g. to evacuate the place.
All low-level and high-level event data is stored in a data warehouse for online and post-hoc analysis.
SWEET users
For the demonstration we distinguish between two types of users:
• SWEET participants: They have downloaded the SWEET app, installed it on their smartphone and agree to be monitored at the event. They carry their phone in a normal way, measures are made continuously, and sensory tweets are sent out at intervals (e.g. once a minute). They may make photo tweets or text tweets, which are processed by the SWEET server.
• SWEET followers: They have not installed SWEET on their smartphone but they have signed up as a follower of the SWEET twitter channel to receive messages related to the event. This includes first responders plus any other interested visitor to the event.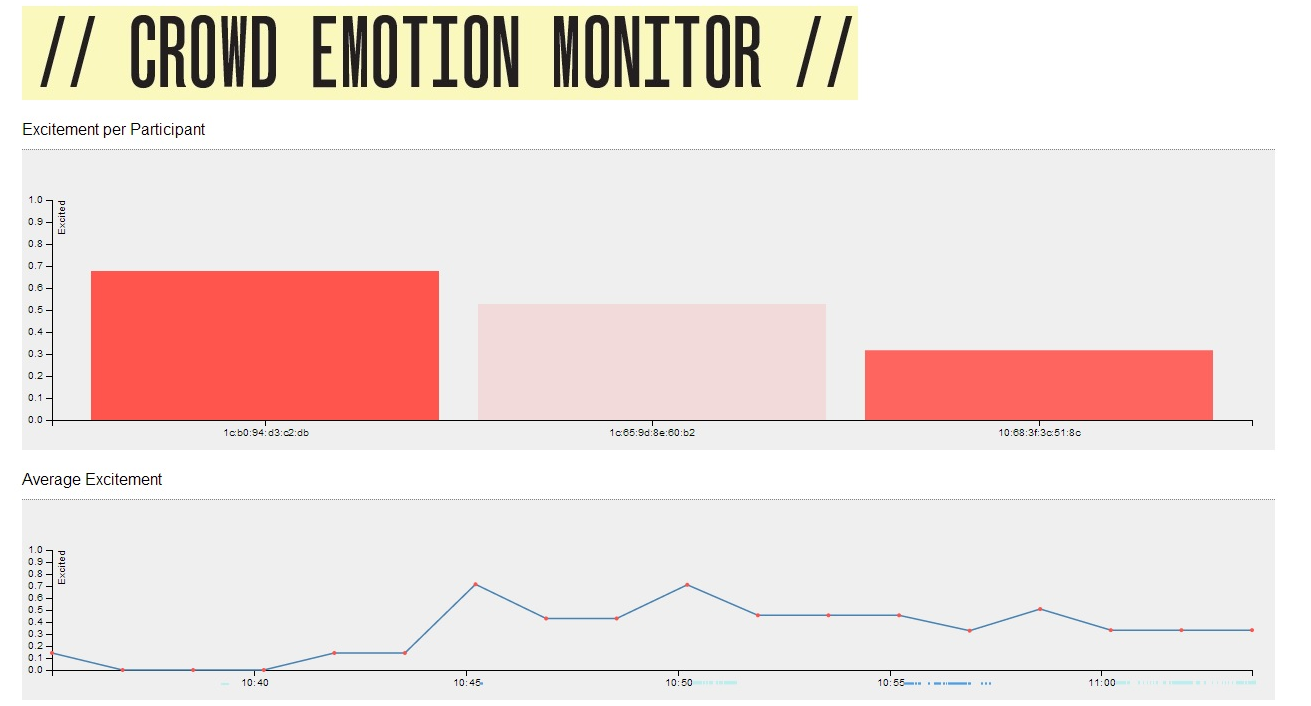
Figure 3: Demo screenshot.
Want to join the Crowd Emotion Monitor? Find out more!

